
티스토리 뷰
모든 실습 코드는 Ref [1]을 확인해주세요
목차
- Import
- Display Waveform
- FFT -> Power Spectrum
- SFTF -> Spectrogram
- Cast Amplitude to Decibels
- MFCCs
Import
import numpy as np
import librosa, librosa.display
import matplotlib.pyplot as plt
Display Waveform
FIG_SIZE = (15, 10)
file = "blues.00000.wav"

# load audio file with Librosa
signal, sample_rate = librosa.load(file, sr=22050)
print('signal shape : ', signal.shape)

# WAVEFORM
plt.figure(figsize=FIG_SIZE)
librosa.display.waveplot(signal, sample_rate, alpha=0.4)
plt.xlabel("Time (s)")
plt.ylabel("Amplitude")
plt.title("Waveform")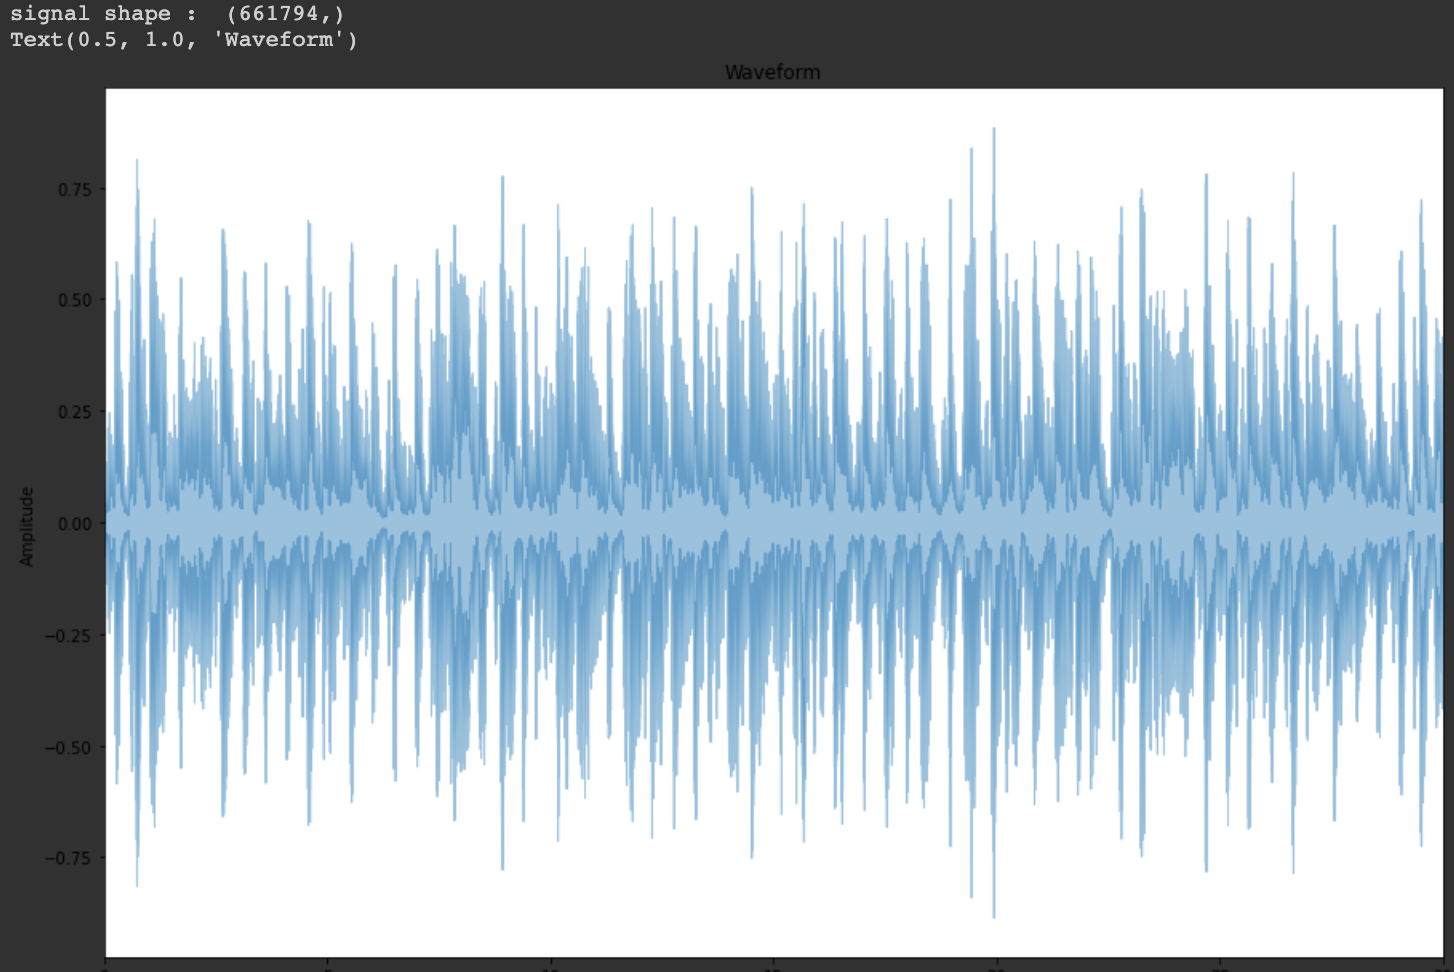
FFT -> Power Spectrum
# perform Fourier Transform
fft = np.fft.fft(signal)
print("fft shape : ", fft.shape)
--> fft shape :  (661794,)

# Calculate abs values on complex numbers to get magnitude
spectrum = np.abs(fft)
print("spectrum shape : ", spectrum.shape)
--> spectrum shape :  (661794,)

# Create Frequency Variable
f = np.linspace(0, sample_rate, len(spectrum))
print("f shape : ", f.shape)
--> f shape :  (661794,)

# take half of the spectrum and frequency
left_spectrum = spectrum[:int(len(spectrum)/2)]
left_f = f[:int(len(spectrum)/2)]
print('left_spectrum shape : ', left_spectrum.shape)
--> left_spectrum shape :  (330897,)

print('left_f shape : ', left_f.shape)
--> left_f shape :  (330897,)

# plot specturm
plt.figure(figsize=FIG_SIZE)
plt.plot(left_f, left_spectrum, alpha=0.4)
plt.xlabel("Frequency")
plt.ylabel("Magnitude")
plt.title("Power spectrum")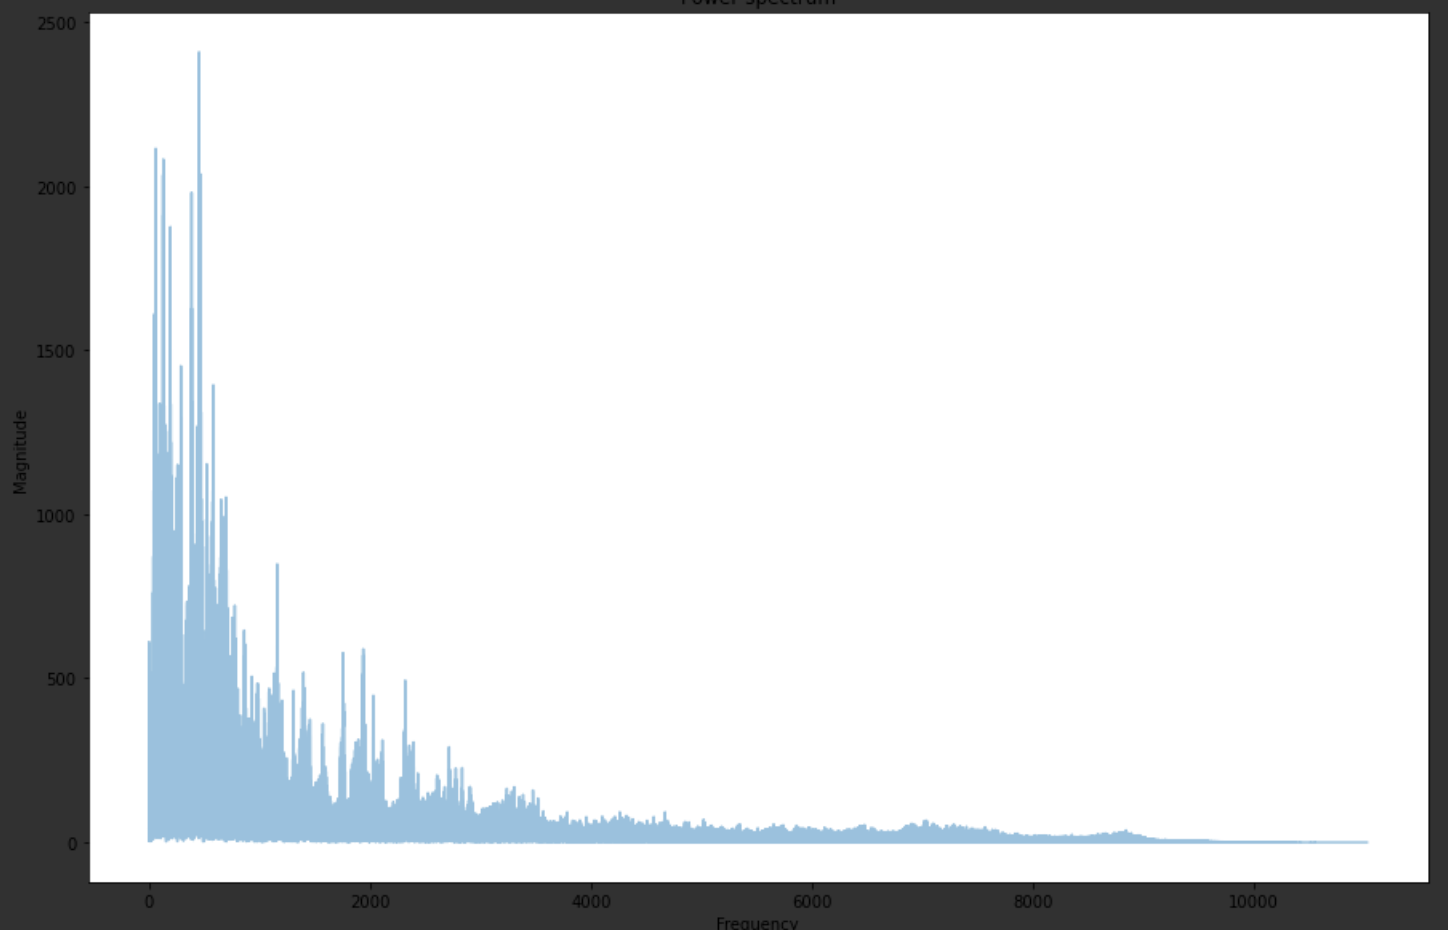
STFT -> Spectrogram
hop_length = 512 # in num. of samples
n_fft = 2048 # window in num. of samples

# Calculate duration hop length and window in seconds
hop_length_duration = float(hop_length)/sample_rate
n_fft_duration = float(n_fft)/sample_rate

print("STFT hop length duration is : {}s".format(hop_length_duration))
--> STFT hop length duration is : 0.023219954648526078s

print("STFT window duration is : {}s".format(n_fft_duration))
--> STFT window duration is : 0.09287981859410431s

# Perform STFT
stft = librosa.stft(signal, n_fft=n_fft, hop_length=hop_length)
print("stft shape : ", stft.shape)
--> stft shape :  (1025, 1293)

# Calculate abs values on complex numbers to get magnitude
spectrogram = np.abs(stft)
print("spectrogram shape : ", spectrogram.shape)
--> spectrogram shape :  (1025, 1293)

# display spectrogram
plt.figure(figsize=FIG_SIZE)
librosa.display.specshow(spectrogram, sr=sample_rate, hop_length=hop_length)
plt.xlabel("Time")
plt.ylabel("Frequency")
plt.colorbar()
plt.title("Spectrogram")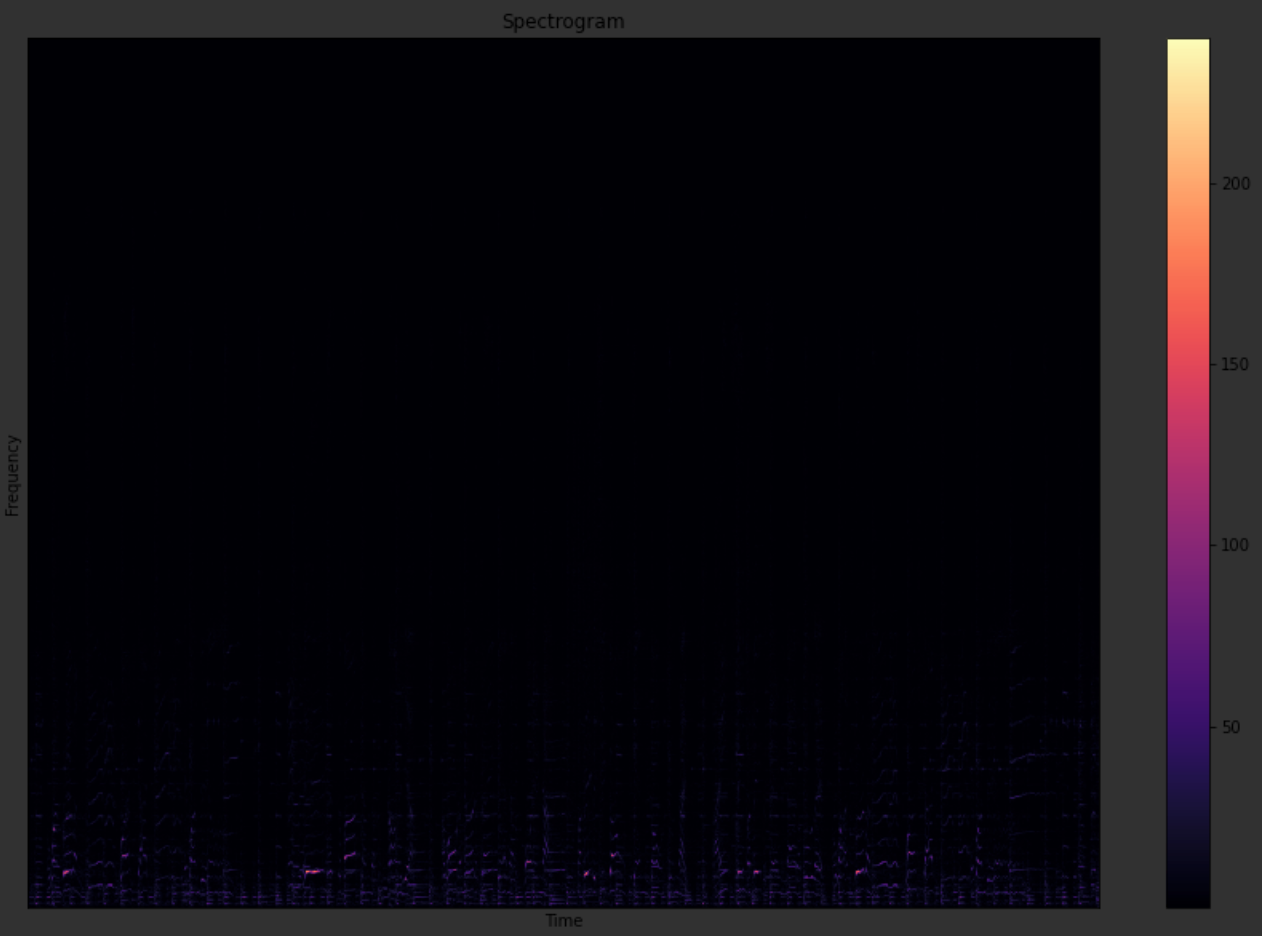
Cast Amplitude to Decibels (apply logarithm)
# apply logarithm to cast amplitude to Decibels
log_spectrogram = librosa.amplitude_to_db(spectrogram)
print("log spectrogram shape : ", log_spectrogram.shape)
--> log spectrogram shape :  (1025, 1293)

plt.figure(figsize=FIG_SIZE)
librosa.display.specshow(log_spectrogram, sr=sample_rate, hop_length=hop_length)
plt.xlabel("Time")
plt.ylabel("Frequency")
plt.colorbar(format="%+2.0f dB")
plt.title("Spectrogram *dB")
MFCCs
# Extract 13 MFCCs
MFCCs = librosa.feature.mfcc(signal, sample_rate, n_fft=n_fft, hop_length=hop_length, n_mfcc=13)
print('MFCCs.shape :', MFCCs.shape)
--> MFCCs.shape : (13, 1293)

# Display MFCCs
plt.figure(figsize=FIG_SIZE)
librosa.display.specshow(MFCCs, sr=sample_rate, hop_length=hop_length)
plt.xlabel("Time")
plt.ylabel("MFCC Coefficients")
plt.colorbar()
plt.title("MFCCs")
Ref
[1] musikalkemist, DeepLearningForAudioWithPython - part 11
[2] Waveplot Doc (librosa.display.waveplot)
[3] Specshow Doc (librosa.display.specshow)
'Audio Signal Processing > Practice' 카테고리의 다른 글
| [Pytorch] 음성 신호 전처리 (spectrogram, melspectrogram) (1) | 2020.07.15 |
|---|
댓글
공지사항
최근에 올라온 글
최근에 달린 댓글
- Total
- Today
- Yesterday
TAG
- wavenet
- 알고리즘 강의
- 오디오 전처리
- aws cli
- nlp 트렌드
- TF2.0
- 핵심어 검출
- netron
- RNN
- boto3
- 6.006
- S3
- Tensorflow2.0
- stft
- lambda
- 알고리즘
- nlp
- 모델 시각화
- BOJ
- MFCC
- nlg
- 시계열
- AWS
- MIT
- keras
- tensorflow
- librosa
- 인공지능 스피커 호출
- Introduction to Algorithm
- LSTM
| 일 | 월 | 화 | 수 | 목 | 금 | 토 |
|---|---|---|---|---|---|---|
| 1 | 2 | 3 | 4 | |||
| 5 | 6 | 7 | 8 | 9 | 10 | 11 |
| 12 | 13 | 14 | 15 | 16 | 17 | 18 |
| 19 | 20 | 21 | 22 | 23 | 24 | 25 |
| 26 | 27 | 28 | 29 | 30 |
글 보관함